
December 10, 2025
Article
Every finance department relying on SAP knows the story: massive exports, inconsistent structures, manual corrections, endless Excel sheets — and a month-end closing process that feels more chaotic than controlled.
As SMEs scale, these challenges only multiply. Controllers spend more time cleaning data than analyzing it, and strategic insights are delayed by days or even weeks.
But a new approach is emerging.
Through Power Query, it is now possible to automate the entire transformation pipeline — converting unrefined SAP data into a structured financial database that feeds P&L statements, IFRS-compliant reports, and dynamic Power BI dashboards.
This article explores how this system works and why it’s rapidly becoming the new standard for financial reporting automation.

1. Turning Raw SAP Exports into a Clean, Reliable Database
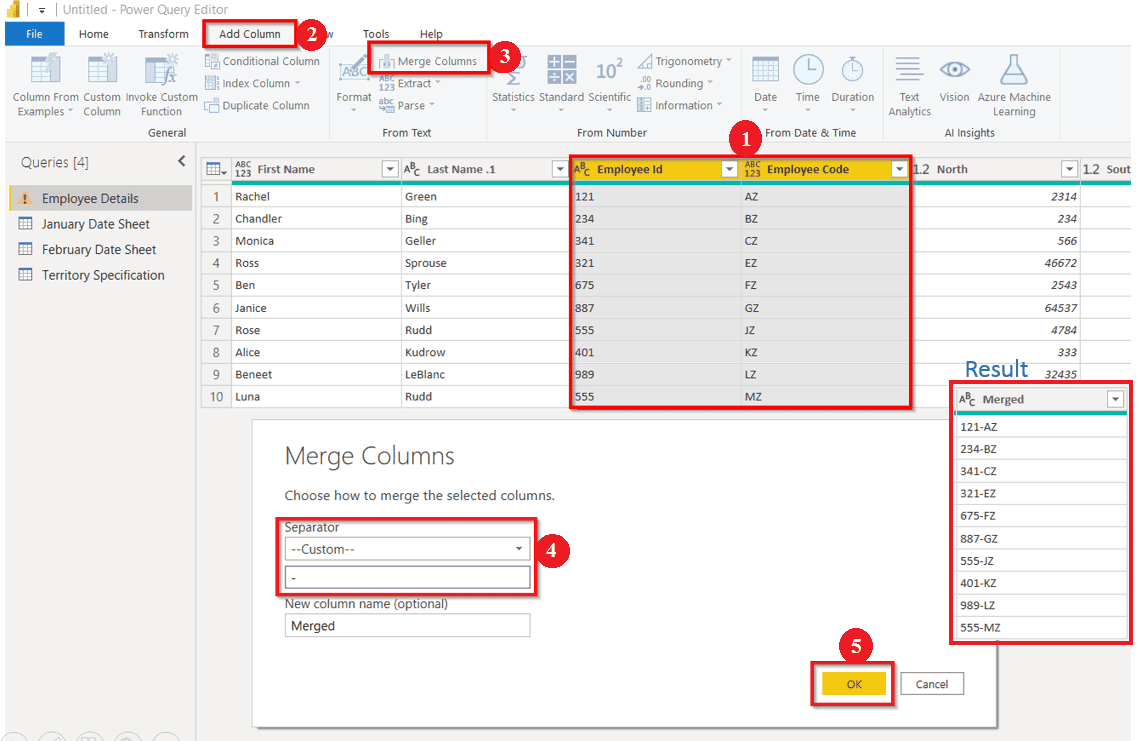
SAP exports typically contain mixed formats, redundant fields, merged columns, inconsistent naming, and historical anomalies accumulated over years.
Power Query solves this by creating a fully automated data-cleaning workflow:
Normalizes GL accounts, cost centers, and product hierarchies
Corrects date formats and fiscal periods
Handles missing codes, duplicate lines, and legacy mappings
Merges multiple SAP tables (FI/CO, SD, MM) into a unified structure
Applies business logic and IFRS groupings through mapping tables
The result is an analysis-ready financial dataset that updates automatically whenever new SAP data is dropped into the folder.
2. Eliminating Manual Excel Work Through Automated Pipelines
Before automation, controllers often repeat the same steps every month: filter, unpivot, copy, paste, VLOOKUP, clear errors, reconcile totals, realign periods — sometimes across dozens of files.
Power Query replaces all of this with repeatable M-code logic.
Once established, the pipeline:
Refreshes in seconds
Produces the same reliable structure every time
Removes human error from month-end processing
Allows new team members to access insights instantly
What previously took days now takes minutes.
3. Building P&L, IFRS Reports, and Power BI Dashboards on Top of a Single Source of Truth
With clean data in place, finance teams can finally focus on insight rather than data preparation.
From the unified dataset, you can instantly generate:
P&L pivots
Full drill-down (GL → cost center → product → customer)
Margin tracking and variance analysis
Trend monitoring across fiscal periods
IFRS-aligned reports
Automated account groupings
OPEX/COGS classifications
IFRS hierarchy management using mapping tables
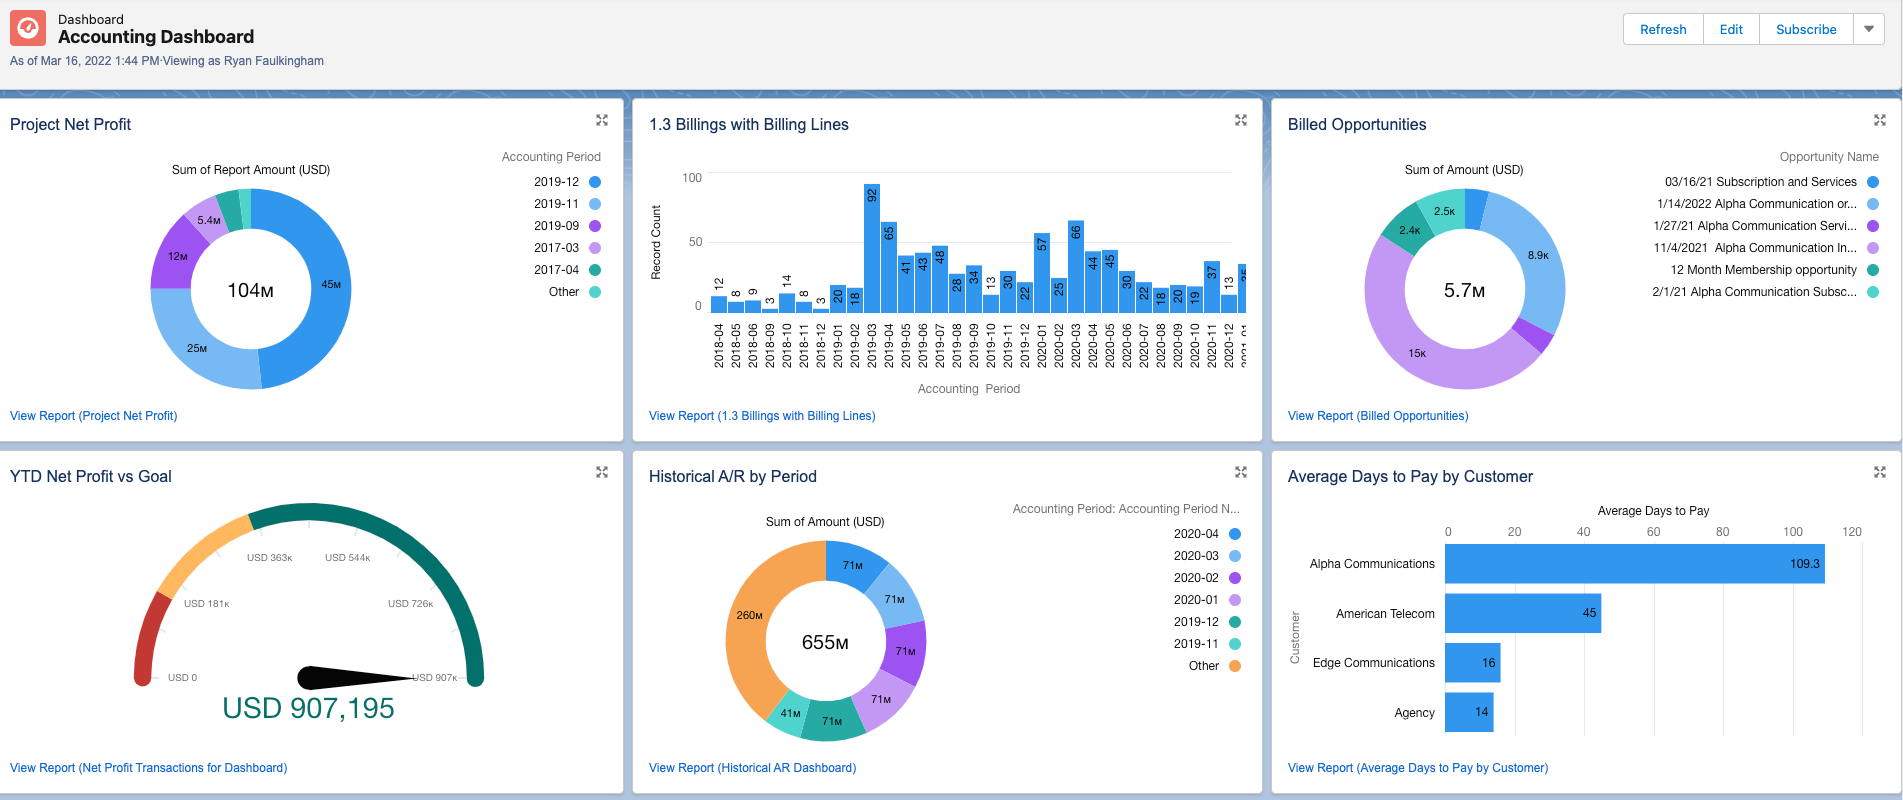
Power BI dashboards
Profitability dashboards
Cost center performance
Volume/mix/price effect
Real-time KPIs
All reports update from the same data model — ensuring consistency across the entire finance function.
4. Why This Matters for SMEs
SMEs typically lack full-scale IT support or internal BI teams.
Power Query solves this gap by offering enterprise-grade automation without requiring:
coding
developers
additional SAP modules
expensive BI infrastructure
Finance becomes more agile, less dependent on manual work, and significantly more accurate.
Conclusion
Transforming unrefined SAP data into automated financial reports was once reserved for large corporations with extensive IT budgets.
Today, Power Query democratizes this capability — allowing SMEs to build a powerful financial reporting engine from the tools they already use.
The result is simple: clean data, faster decisions, and a finance team focused on analysis instead of cleanup.